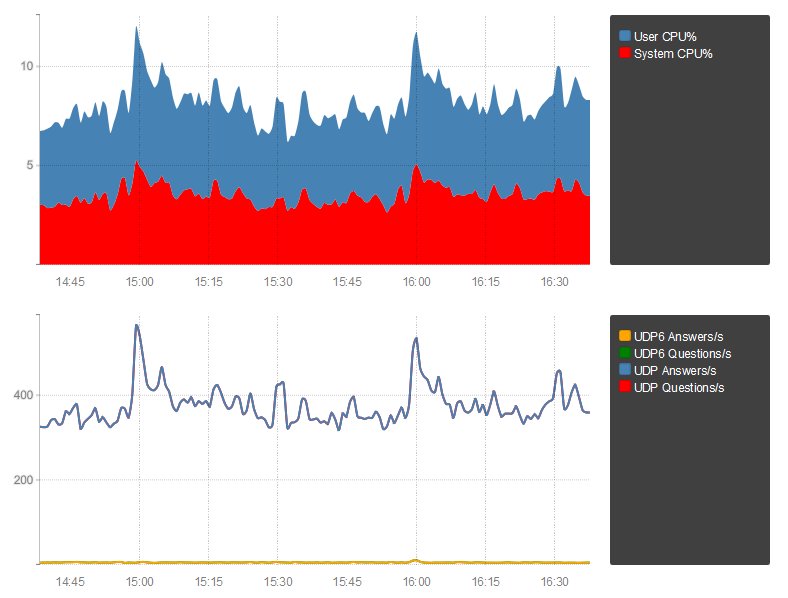
If you’re running PowerDNS recursor, PowerDNS authoritative server or dnsdist, you may wonder how those services are actually doing. You can add a basic ‘service is functional’ check to your Nagios or Icinga installation, and even add some graphing to your Observium installation, but in reality, those will give you no more than a rough idea of what is happening.
However, those three pieces of software all share a common way of reporting more specific metrics to a centralized server speaking the ‘carbon’ protocol. Launched in 2014, PowerDNS provides a public service where you can send your metrics – useful if you have an issue or if you need some professional or community support, as sometimes the cause can become clear immediately just by looking at the data sent through.

For some people, having their data in public is no good (even though you can disguise your server name to whatever string you want), or an outgoing firewall is simply blocking the traffic. The good news is, you can also run your own server locally and push your metrics there!
Installing Metronome
On your target system, clone the git repository located at Github, install required build dependencies, and build the project to install in /opt/metronome:
git clone --recurse-submodules https://github.com/ahupowerdns/metronome
apt-get install build-essential aautomake autoconf libtool libeigen3-dev libboost-dev libboost-program-options-dev
cd metronome
./bootstrap
./configure --prefix=/opt/metronome
make
Then, as root, install the program into /opt/metronome, and also copy the HTML directory from the source:
make install
cp -a html /opt/metronome
Create a user for the Metronome daemon to run as (don’t run stuff [that listens on a network port] as root!):
useradd --home-dir /opt/metronome -c "PowerDNS metronome" metronome
Next, create a directory for Metronome to store the received metrics in:
mkdir /opt/metronome/stat
chown -R metronome: /opt/metronome/stats/
In your favourite text editor, edit /opt/metronome/html/local.js and set the metronomeServer variable to the correct IP address your Metronome server is running on:
"use strict";
var metronomeServer="http://192.168.0.1:8000/";
Now, we configure Apache to have its own virtual host (you could probably also use a subdirectory path instead) and serve up the HTML files that Metronome provides, in /etc/apache2/sites-available/metronome.example.com:
<VirtualHost *:80>
  ServerName metronome.example.com

  DocumentRoot /opt/metronome/html

  ErrorLog /var/log/apache2/metronome-error.log
  CustomLog /var/log/apache2/metronome-access.log combined

  <Directory /opt/metronome/html>
    Require all granted
  </Directory>

  LogLevel alert
  ServerSignature Off
</VirtualHost>
Then, enable the virtual host and reload apache2:
a2ensite metronome.example.com
systemctl reload apache2
Last but not least, we’ll create a systemd unit file to run the daemon in /etc/systemd/system/metronome.service:
[Unit]
Description=PowerDNS Metronome
After=network.target

[Service]
ExecStart=/opt/metronome/bin/metronome --daemon=0 --stats-directory=/opt/metronome/stats --disable-syslog
User=metronome

[Install]
WantedBy=multi-user.target
Next, we reload systemd and start the daemon!
systemctl daemon-reload
systemctl enable metronome
systemctl start metronome
Please note that, as long as no data has been received from any monitored server, the web interface will not work correctly as the Javascript code will fail to retrieve data.
Configuring PowerDNS
PowerDNS Recursor
Add the following line to recursor.conf:
carbon-server=192.168.0.1
PowerDNS Authoritative Server
Add the following line to pdns.conf:
carbon-server=192.168.0.1
dnsdist
Add the following line to dnsdist.conf:
carbonServer('192.168.0.1')
Next steps
In the next article in this (2-part) series, I’ll add some information on how to secure this setup. Please note, if you’re running the interface on the internet, it’ll currently be open to anyone. This means on one hand, anyone can send data to your Metronome instance (possibly filling up your disk or using up a lot of CPU time?), and they’ll be able to access your statistics as well, as there is no authentication used on the web page, and no TLS transport security either.